

I’ve finally found time to have a serious attempt at constructing some infographics. I have found a number of potential sites to explore to help me with this, and I started with Piktochart.
Piktochart is free to begin with, but once you have discovered exactly how much can be done with the tools on offer here, it is likely you will want to fork out for for one of the upgrade plans. There is a wide range of templates available, using colour, style and data to make the visuals appealing. However, the site is so easy to navigate and has so many easy to use tools, that is really easy to build your infographic from scratch.
There is a wide range of backgrounds to pick from, and a multitude of graphics and clip art available to illustrate your work. There are also some photos, and it is dead easy to upload your own. Text and data can be added in a number of interesting ways, and for me the best tool is the graphing button which allows you to input your own data and convert it into line graphs, pictograms, bar charts etc
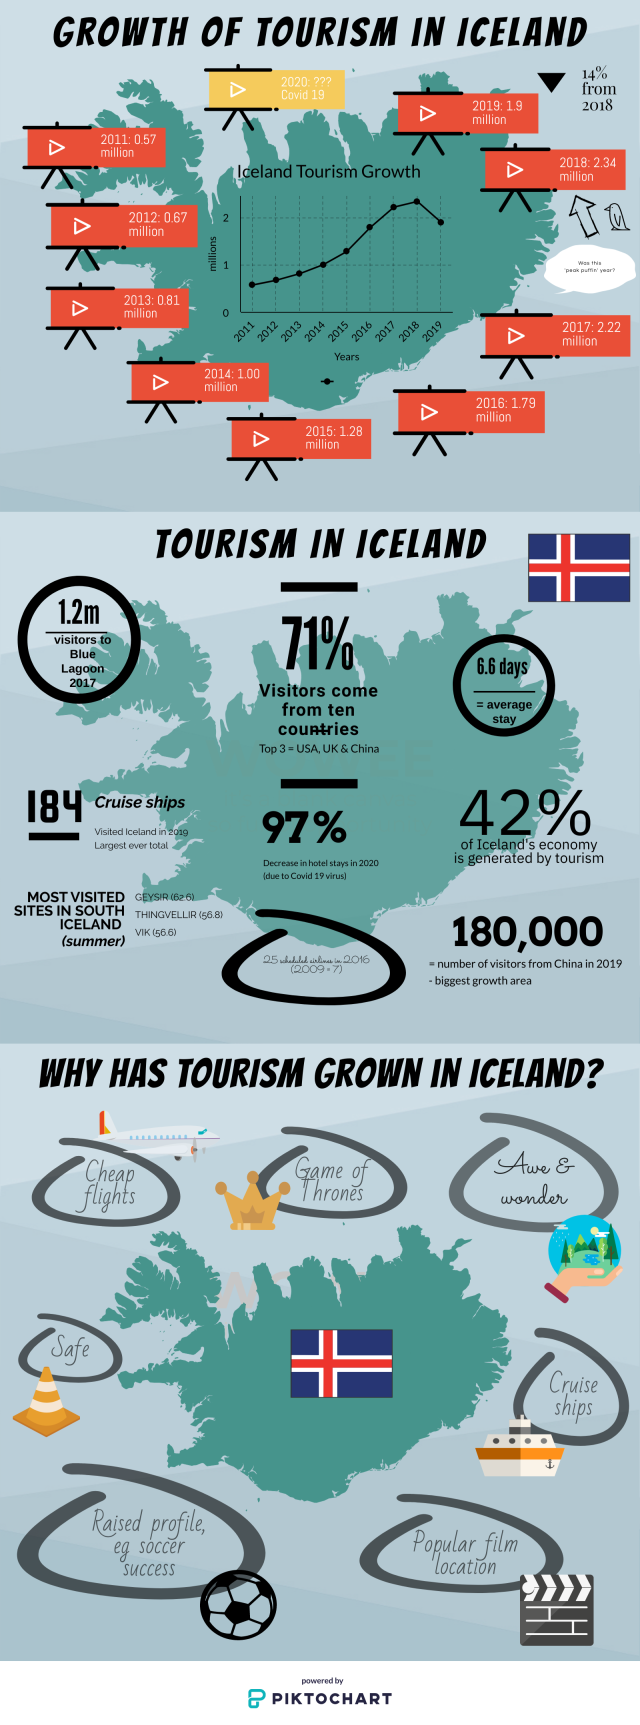
Piktochart works by building a series of blocks that flow neatly into an extended infographic. Here is my first attempt capturing some key information for the topic of tourism growth in Iceland:
Piktochart’s classroom application includes allowing the teacher to create innovative presentations or posters that distill information into understandable chunks. Students should respond well to the sleek designs possible. Also, students can easily create their own infographics, reports, or presentation slides for any subject or data provided. Grouping and organizing information, as well as creating clever designs, will help them to develop analytical and spatial thinking skills.
Piktochart can also be used to create single slide graphics for use on posters, or as individual slides in a PowerPoint presentation. The site also includes detailed video tutorials for each step of the process.
I have been very impressed with the ease of use of Pictochart, and the results that it can achieve. However, I intend to try some alternatives in later blogs – including: Canva, Venngage, easel.ly and Visme.
If you have any favourites that work well for you – please let me know.

Pingback: Climate Change Infographics For The Classroom | Devon Geography